More about S3 Storage
- S3 Intelligent-Tiering's Archive Instant Access Tier
- Amazon S3 Storage Lens: A Single Pane of Glass for S3 Storage Analytics
- S3 Access: How to Store Objects With Different Permissions In the Same Amazon S3 Bucket
- S3 Lifecycle Rules: Using Bucket Lifecycle Configurations to Reduce S3 Storage Costs
- S3 Storage: The Complete Guide
- S3 Pricing Made Simple: The Complete Guide
- How to Copy AWS S3 Objects to Another AWS Account
- Amazon S3 Bucket Security: How to Find Open Buckets and Keep Them Safe
- How to Test and Monitor AWS S3 Performance
- How to Secure S3 Objects with Amazon S3 Encryption
- How to Secure AWS S3 Configurations
- Comparing AWS SLAs: EBS vs S3 vs Glacier vs All the Rest
- AWS Certification Cheat Sheet for Amazon S3
Subscribe to our blog
Thanks for subscribing to the blog.
January 30, 2022
Topics: Cloud Volumes ONTAP AWSAdvanced9 minute read
Amazon S3 Storage Lens is a purpose-built cloud storage analytics solution that can help manage and optimize complex and diverse Amazon S3 storage deployments across an entire organization, irrespective of their geographical distribution.
This article takes a closer look at Amazon S3 Storage Lens and how it can be leveraged to gain organization-wide visibility into object storage and identify operational intelligence to optimize your S3 deployments.
Use the links below to jump down to the sections on:
- The AWS S3 Storage Control and Monitoring Challenge
- Introduction to AWS Storage Lens: A Control and Monitoring Console for AWS S3 Storage
- Storage Lens Dashboards
- Leveraging Storage Lens Dashboards
- Storage Lens Pricing
- Get More AWS Storage Optimization with Cloud Volumes ONTAP
The AWS S3 Storage Control and Monitoring Challenge
At the enterprise level, the use of cloud-based object storage solutions such as Amazon S3 tend to be advanced and complex.
A typical S3 use case within an enterprise organization could consist of numerous Amazon S3 regions, with multiple AWS buckets each with differing configurations, such as storage classes. There could also be a mixture of ancillary features such as versioning and snapshots in use within each S3 bucket to meet various application and business requirements.
On top of managing these disparate environments and their S3 buckets, users also need to worry about storage costs across these environments because they are billed on data transfer and how and where the total space they occupy. As more and more storage workloads are created in or moved to the cloud as time goes on, often by different regional IT teams and line-of-business owners with no internal oversight, organizations have found it difficult to keep track of their underlying storage consumption across the board.
The result of all these factors is that many organizations find it challenging to optimize their S3 storage usage in a meaningful and effective way.
Introduction to AWS Storage Lens: A Control and Monitoring Console for AWS S3 Storage
To overcome these challenges, AWS introduced Amazon S3 Storage Lens: a purposefully built storage analytics solution as a free add-on available to all Amazon S3 customers. Amazon S3 Storage Lens provides a single-pane-of-glass view of your S3 storage across the entire AWS account and organization through a dashboard view. This centralized visibility of the S3 buckets and the data stored in them can then be leveraged to meaningfully optimize S3 storage utilization and reduce storage costs throughout the organization.
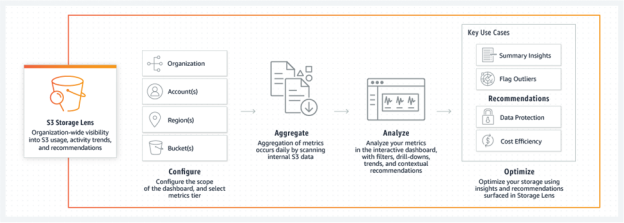 Image from S3 Storage Analytics and Insights – Amazon S3
Storage Lens Dashboards
Amazon S3 Storage Lens dashboards provide a single-pane-of-glass view for S3 storage that displays the usage and activity metrics for detailed visibility. The dashboard overview page provides key usage statistics such as the total storage, object count, average object size, active buckets, the number of AWS accounts, and other useful information.
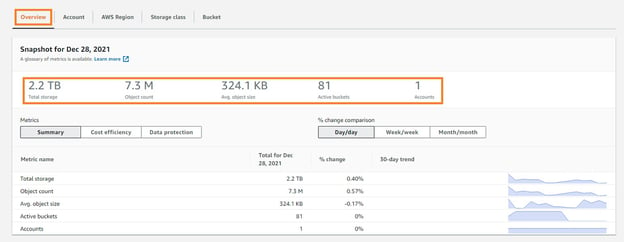 The default Storage Lens dashboard.
By default, all Amazon S3 customers have access to a default dashboard (titled “default-account-dashboard”) which covers all the Amazon S3 accounts in the organization. This dashboard is accessed through the Amazon S3 Storage Lens page.
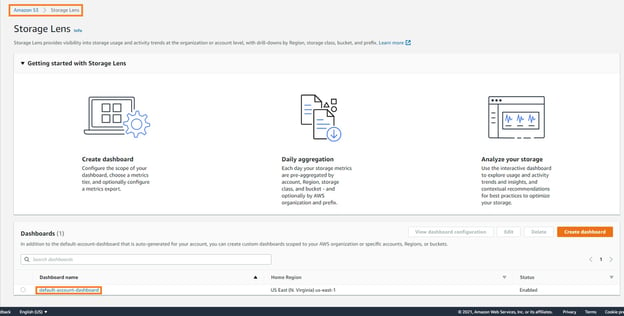 The Storage Lens default dashboard
The default Storage Lens dashboard can be a good starting point for many customers to get a holistic insight into their overall S3 storage usage. The default dashboard provides overall storage trends and distributions over a specified period which can be vital data for the IT department to understand historical utilization trends. Such trends can potentially be used to predict future usage patterns and therefore, the budget requirements.
In addition, the storage class distribution graph can be leveraged to gain clear understanding of the different storage classes in use across the organization, potentially paving the way for cost optimization by moving data to less expensive storage tiers.
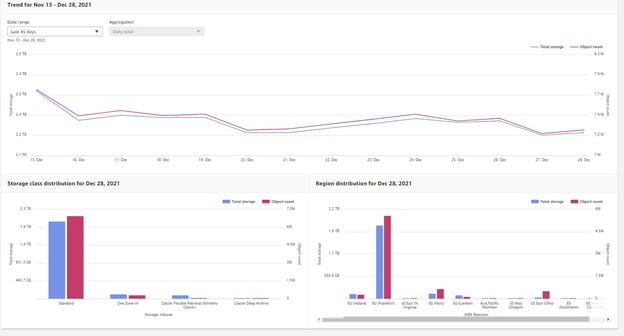 The storage class and distribution graph
The default dashboard also provides an overview of the top number of accounts/regions/buckets in the organization and their storage statistics such as total storage and change rate percentage.
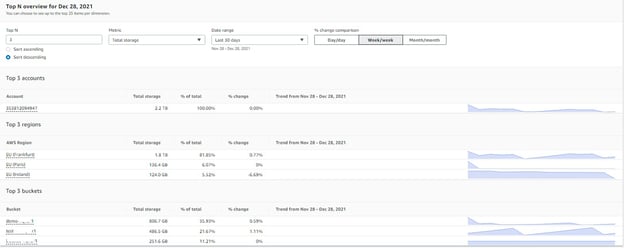
The default dashboard provides useful statistics covering over 30 storage metrics. It is important to also note that the default dashboard configuration is set to utilize the free metrics by default. That makes this dashboard free for all customers until they start leveraging additional (advanced) metrics by customizing the dashboard configuration.
Leveraging Storage Lens Dashboards
In addition to the default dashboard, customers can also create custom dashboards based on specific organizational, departmental, or regional visibility requirements. These can include using the same set of free metrics or, where required, advanced S3 metrics.
Creating a custom dashboard is simple and intuitive using the Storage Lens Dashboard view.
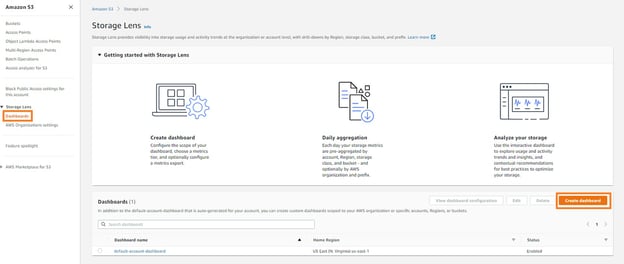 Creating a custom Storage Lens dashboard
During the creation of the dashboard, customers have the option to set up a home region (where all the observed storage metric statistics are stored), the dashboard scope (specific regions and buckets), and advanced metrics and recommendations (though this comes at an additional cost). Note that it can take up to 48 hours from the creation of custom dashboards for the data to become visible on the dashboard.
S3 Storage Lens dashboards can be leveraged to address a number of use cases. For the purpose of illustration within this post, let’s take a look at three specific use cases and how the information found within a dashboard can be leveraged to address each use case. (Note that there are various additional use cases that aren’t referenced in this article).
Identify Your Storage Buckets and Their Distribution
The Storage Lens dashboard provides detailed analysis of storage buckets across the entire AWS account or organization in order to identify previously unknown buckets that might be in use within various regions or departments of the organization. This information would be particularly useful to global, geographically dispersed organizations where there are numerous IT and departmental teams that are each in charge of their own IT infrastructure. The distribution by bucket dashboard can be leveraged to identify the largest storage consumers across the organization to prioritize where to begin making storage and cost optimizations.
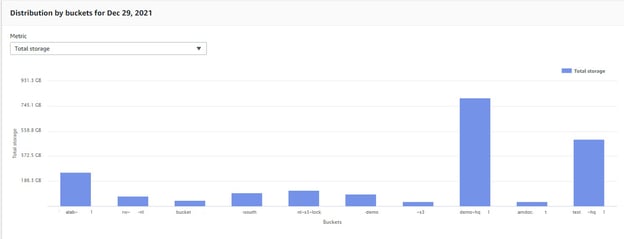 Bucket distribution and size graph
Identify Cold Data
Advanced metrics such as activity metrics found within the S3 Storage Lens dashboard’s Bubble analysis chart provide insight into information such as “Get” requests and “List” requests which can be leveraged to identify frequently accessed (hot) data versus data that's not frequently accessed, or not accessed at all (cold data).
 Bubble analysis chart
There are various additional activity metrics that can provide further insights into how the data stored on various S3 buckets are accessed (or not). IT teams can leverage that information to gain better visibility of cold data across the entire estate. Such insights can help optimize storage utilization where the cold data can be tiered off to less expensive storage tiers or permanently aged out and archived off for storage cost savings.
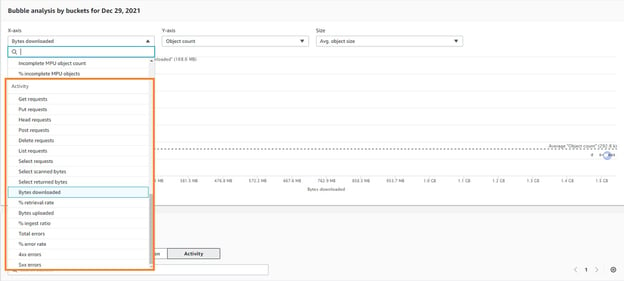 Viewing bucket activity in the bubble analysis chart
Identify S3 Storage Class Distribution
There are different tiers of Amazon S3 storage classes, each of which has its own performance and availability characteristics as well as costs. Enterprise customers with large and complex S3 storage requirements are highly encouraged to understand these characteristics and place their S3 data into the most appropriate tier for maximum total cost of ownership (TCO) efficiency.
The Storage Lens dashboard’s “Storage Class Distribution” bar graph provides easy visibility into the overall data distribution among all the AWS S3 storage tiers. Based on this intelligence, customers can subsequently leverage Amazon S3 lifecycle policies to automatically move S3 data between tiers in order to achieve cost savings.
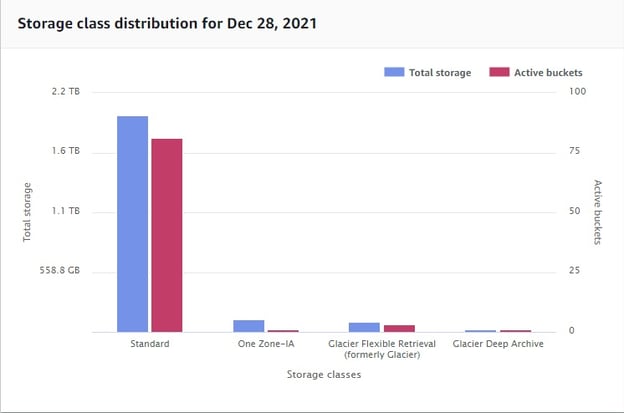 Storage class distribution chart
The storage classes table also provides additional information such as the percent of data that is current (in bytes) which can be easily leveraged to identify older versions that can be easily removed, or tiered off to a less expensive tier using Amazon S3 lifecycle policies.
 Storage class cost efficiency
In addition to the above, the Region distribution graph can be leveraged to identify regional distribution of data across all the global AWS regions. Customers who operate in regions with data residency and various other governance requirements that can’t be met by an existing AWS region can leverage this view to understand their level of compliance and apply remediation actions if required.
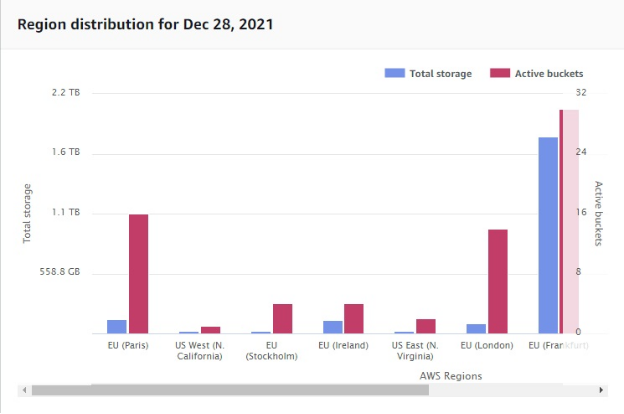 Regional bucket distribution
Storage Lens Pricing
While the Storage Lens dashboards themselves are free and come with a number of free metrics that cover most use cases and basic analytics requirements, advanced metrics and recommendations cost $0.20 per million objects monitored per month. Charges are also applied for each of the Storage Lens dashboards that are leveraged. Storage Lens also has some package deals for advanced metrics and recommendations. These are bundled with CloudWatch support, prefix-level aggregation, data retention for 15 months, and other metrics of user activity. Please use the AWS Pricing Calculator for the most up to date pricing and accurate estimations.
Get More AWS Storage Optimization with Cloud Volumes ONTAP
Amazon S3 users who are trying to optimize their storage usage should also take a look at NetApp Cloud Volumes ONTAP for AWS. With Cloud Volumes ONTAP’s storage efficiency features, users can decrease the total size of the data estate. These features include data deduplication, compression, compaction, tiering between Amazon EBS and Amazon S3, highly efficient snapshot technology, and instant data clones that only consume storage space for the delta.
FAQs
Is Amazon S3 object storage?
Amazon S3 is the object storage offering on AWS. Object storage is useful in that it allows large amounts of data to be stored at extremely effective costs. There are several access level tiers of Amazon S3 storage to further optimize your costs based on the data’s lifecycle and usage pattern.
What is an Amazon S3 bucket?
An Amazon S3 bucket is where Amazon S3 stores objects. The maximum amount of data a bucket can hold is 5 TB, with individual objects limited to up to 5 GB per PUT request. Buckets can have adjustable access permissions so users can decide who has access to the data stored in each bucket to better ensure security.
What is the Storage Lens Dashboard?
The main Amazon Storage Lens dashboard gives users a single view of their S3 storage usage and metrics. The details that can be seen on the main dashboard include the amount of data stored in total, the average size of each object, the total number of objects, and more.

