Share
Your storage environment may not always be the most transparent part of your deployment. How is its performance, and what kind of capacity are you using? You can add monitoring tools to keep track, but if you’re an ONTAP-based system user, there’s an easier way to do that with NetApp Harvest.
NetApp Harvest is an open-source tool that you can use to get more insight into ONTAP-based and StorageGRID environments. It collects data from your system, such as capacity and performance metrics, then translates that into information that’s routed to a time-series database of your choice.
In this blog post, you’ll find all the steps needed to deploy a basic instance of NetApp Harvest, which you can use to monitor your Amazon FSx for NetApp ONTAP deployment.
Use these links to jump down to the relevant sections:
- Introduction
- Before you get started
- Installation procedure
- Reviewing the dashboards
- Simplifying and Streamlining Operations with NetApp Cloud Insights
Introduction
This guide will give you the steps needed to deploy a basic instance of NetApp Harvest, with the end goal of being able to monitor FSx for ONTAP.
Because we’re showing how to set up Harvest for FSx for ONTAP, the example here shows the steps using Amazon EC2 running Amazon Linux 2. There already is a guide that shows how to set this up, but this version aims to be a bit more thorough.
Before you get started
There are a few prerequisites you should have in place before you set up Harvest:
- An Amazon EC2 instance with 4CPU and 16GB RAM, like t2.xlarge, running Amazon Linux 2, with 8GB EBS. This instance should be placed in the same subnet of FSx for ONTAP.
- Assign a Public IP to this EC2 instance at creation. This step is required only if you want to access your monitoring platform from the internet.
- Any system running ONTAP, whether it’s on premises or in the cloud. In this example, we’re setting up Harvest to work with FSx for ONTAP.
To be able to access Grafana via the internet, you’ll need to create a rule in the Security Group to open port 3000.
Installation procedure
There are three components that need to be installed and configured:
- NetApp Harvest, the tool that collects performance data.
- Prometheus DB, where the performance data will be stored.
- Grafana, the tool used to present dashboards.
Harvest collects the data (either via Zapi or Rest API) and then feeds it to Prometheus via HTTP. Grafana needs to be configured to have a data source in Prometheus to show the data in its dashboards.
Note: To edit files in Linux I use “vim”, but you can use whatever tool you prefer.
One other important message about this guide: the steps below must be followed in the order they are presented. Jump ahead at your own risk!
-
General update and applications
In this section we are going to show how to update and install all the relevant components. Of course, it’s not recommended, but since we aren’t talking about security, I assume all commands are executed as root.
- Update Amazon Linux
Run the following command to update your Amazon Linux OS:dnf update -y - Install GO.
Because NetApp Harvest is developed in GO, you’ll need to install it in order to compile the binaries.
We’re installing version 1.21.1. in this example, but please check that you’re using the latest release:cd /
wget https://go.dev/dl/go1.21.1.linux-amd64.tar.gz
tar -xvf go1.21.1.linux-amd64.tar.gz
sudo mv go /usr/local/
export PATH=$PATH:/usr/local/go/bin
export GOPATH=$HOME/go
export PATH=$PATH:$GOPATH/bin
go version - Install NetApp Harvest
Now we’re going to install Harvest, and make sure it’s running the most up to date version.
Use the following command, which will always install the most recent version of Harvest:cd /
git clone https://github.com/NetApp/harvest.git
cd /harvest/
make build
bin/harvest version - Install Prometheus.
Next, we’re installing Prometheus. Make sure you’re using the latest release. For this example, we’re installing version 2.47.0.
Run the following command to install Prometheus:cd /
wget https://github.com/prometheus/prometheus/releases/download/v2.47.0/prometheus-2.47.0.linux-amd64.tar.gz
tar xvfz prometheus-2.47.0.linux-amd64.tar.gz prometheus-2.47.0.linux-amd64/ - Install and start Grafana
Now you need to install Grafana and set it to start automatically. Make sure you install the latest version; for this example, we are installing version 10.1.2.1.
Install Grafana using the following command:sudo dnf install -y https://dl.grafana.com/enterprise/release/grafana-enterprise-10.1.2-1.x86_64.rpm
sudo systemctl start grafana-server
sudo systemctl enable grafana-server
- Update Amazon Linux
-
Logging into Grafana and API token creation
You should now be able to log in to Grafana, even if nothing is configured. In your browser of choice, enter the EC2 IP address on port 3000: http://EC2PublicIP:3000, replacing “EC2PublicIP” with your EC2 instance’s private or public IP.- First log In
You need to provide both username and password. You can use the default answers:
User: admin
Password: admin
After you log in to Grafana you’ll be asked to change your password. - Create a service account
Click on the three-line, hamburger menu icon at the top left of the screen to open the menu.
In the menu, select “Administration” and then select “Service Account”.
In the service account options, select “Add Service Account”. Then enter:
- Display Name: “Harvest”
- Role: “Editor”
- Create an API token
Now we’ll create the API token. Start by navigating back to the Service Account menu.
In the Service Account menu, click “Add Token” for the Harvest user.
Click on “Generate Token”.
Click on “Copy to clipboard and close”.
IMPORTANT: This is the only chance you’ll get to save the token. Once it’s created, paste it immediately in a .txt file and save it. Harvest is going to need it in the next step of the set-up process.
- First log In
-
Import Dashboards in Grafana
Go back to the EC2 command line and enter the following information. Note that here’s where you’ll need that API token you created in the last step:cd /harvest
bin/harvest grafana import --addr localhost:3000
#### You will be requested to 'Enter API Token'
#### Enter the token saved before
#### You will be asked to save token for later use, enter 'Y'It will take a few seconds but in the end all dashboards will be imported.
-
Edit the Prometheus config file
In this step we are going to edit the Prometheus config file so that Prometheus can reach Harvest via port 8887.
Go back to EC2 command line and enter the following command:cd /prometheus-2.47.0.linux-amd64
vim prometheus.yml
### Add the following lines, keep the indentation unchanged####
scrape_configs:
- job_name: harvest
http_sd_configs:
- url: http://localhost:8887/api/v1/sd
### Save and close
Note that the connection above was made with no authentication. If you need to authenticate for security reasons, look for the section “Enable HTTP service discovery in Prometheus” in the Prometheus Exporter documentation. -
Edit the Harvest config file
This is the most important file. Here you will have to add the ONTAP system you want to monitor. Make sure you have all the details about your deployment at hand (that means your Cluster IP, username, and password).
VERY IMPORTANT: Every time you change anything in Harvest configuration files (.yml) you must stop and restart Harvest Poller Service. More on this later.- Removing “#” from code lines
When you edit the file, you will see dozens of lines commented with the "#" character. For example:### edit Harvest configuration fileFor the changes you have to make, you will need to do two things:
cd /harvest
vim harvest.yml
### Make the changes, save and exit- Remove the comment (#) to enable:
- ohttpsd
- olisten: 8887
- Add the ONTAP system you want to monitor.
The Harvest.yml file
Here I post a copy of the final version of harvest.yml that I used to monitor my FSx for ONTAP:Admin:
httpsd:
listen: :8887
Exporters:
prometheus:
exporter: Prometheus
local_http_addr: 0.0.0.0
port: 12990
prometheus1:
exporter: Prometheus
port_range: 13000-14000
Defaults:
collectors:
- Zapi
- ZapiPerf
- Ems
- Rest
- RestPerf
use_insecure_tls: false
Pollers:
# This is an optional poller that provides stats about harvest itself.
# To remove it, simply delete the "unix" section
unix:
datacenter: local
addr: localhost
collectors:
- Unix
exporters:
- prometheus
### this below is my FSxN, I have redacted the IP for security reasons #### You have to change the IP addr. , the username and the password ####
FSXN-01:
datacenter: DC-01
addr: X.Y.Z.K
auth_style: basic_auth
username: fsxadmin
password: yourfsxadminpassword
use_insecure_tls: true # Disable TLS verification when connecting to ONTAP cluster
collectors:
- Zapi
- ZapiPerf
- Rest
- RestPerf
- Ems
exporters:
- prometheus1Basically, for each new ONTAP system that you want to monitor, you need to add the following:
Pollers:

    ### Respect the indentation under Pollers or it won't work ###

    FSXN-01:                            -> Name of the ONTAP system as visualized in Harvest/Grafana
        datacenter: DC-01               -> Name of the DataCenter, you can have more datacenters but I normally leave it like this
        addr: X.Y.Z.K                   -> Cluster Management IP Address
        auth_style: basic_auth          -> This means that we will use Username and Password to authenticate to ONTAP
        username: fsxadmin              -> Username
        password: yourfsxadminpassword  -> Password
        use_insecure_tls: true          -> Leave as it is
        collectors:                     -> These are the 5 engines that Harvest can use to poll ONTAP. For FSxN it will mainly use RestPerf (Rest API)
          - Zapi
          - ZapiPerf
          - Rest
          - RestPerf
          - Ems
        exporters:
           - prometheus1                -> this means that it will use the exported named 'prometheus1', defined before.
- Remove the comment (#) to enable:
- Removing “#” from code lines
-
(Optional) Add more counters to be polled
There are many counters—which are also valid for FSx for ONTAP—that by default are not polled because they may slow down data collection.
To enable counters to be polled, go back to EC2 command line and enter the following:cd /harvest/conf/restperf
vim default.yaml
### Remove the comment (#) from the following lines
Workload: workload.yaml
WorkloadVolume: workload_volume.yaml
WorkloadDetail: workload_detail.yaml
WorkloadDetailVolume: workload_detail_volume.yaml
### Save and exit
cd /harvest/conf/zapiperf
vim default.yaml
### Remove the comment (#) from the following lines
Workload: workload.yaml
WorkloadVolume: workload_volume.yaml
WorkloadDetail: workload_detail.yaml
WorkloadDetailVolume: workload_detail_volume.yaml -
Start the services
I will open 3 SSH connections to my EC2 to run in the process: One for Harvest Admin, one for Prometheus, and one for Harvest poller. Here’s how to set it up.- Harvest Admin and Prometheus
The first SSH session is for Harvest admin mode. This is not the poller, it's the backend service that is used to connect to Prometheus via port 8887.cd /harvest
bin/harvest admin start
Go to the second SSH session, and start Prometheus:cd /prometheus-2.47.0.linux-amd64
./prometheus --config.file=prometheus.yml
If needed, you can kill both services with the key command CTRL-C. If you do that, make sure to restart them or the monitoring will not work. - Add data source in Grafana
Go back to Grafana and log in as admin.
Click on the three-line, hamburger menu icon at the top left, navigate to “Connections” and then “Data Sources.”
In Data Sources, select “Add data source” and then select “Prometheus".
Now add “http://localhost:9090” in the Prometheus server URL.
Click on "Save and test".
Once you save, you should see the message “Successfully queried the Prometheus API” at the bottom of the screen. - Harvest Poller
Now go to the third SSH session and start the Harvest poller:cd /harvest
bin/harvest start
### the output will look something like this ###
[root@ip-172-31-6-241 harvest]# bin/harvest start
Datacenter | Poller | PID | PromPort | Status
-------------+---------+-------+----------+----------
local | unix | 34840 | 12990 | running
DC-01 | FSXN-01 | 34841 | 13001 | running
From this moment, Harvest will start collecting the performance data from the ONTAP system(s). Allow 10-15 minutes of polling before going to look at the data in Grafana. - Harvest configuration changes and poller service
Any time you change a Harvest configuration file (.yml)—for instance if you add another ONTAP storage to monitor—you must then stop and restart Harvest Poller Service to make the changes effective.
Here is how to check the poller service status:cd /harvest
bin/harvest status
### the output will probably look something like this ###
Datacenter | Poller | PID | PromPort | Status
-------------+---------+-------+----------+----------
local | unix | 34840 | 12990 | running
DC-01 | FSXN-01 | 34841 | 13001 | running
Now stop the poller service. After you have made your changes in the yml file(s) you can stop the service:cd /harvest
bin/harvest stop
### the output will probably look something like this ###
Datacenter | Poller | PID | PromPort | Status
-------------+---------+-----+----------+--------------
local | unix | | | not running
DC-01 | FSXN-01 | | | not running
And then you can start the poller service again:cd /harvest
bin/harvest start
### the output will probably look something like this ###
Datacenter | Poller | PID | PromPort | Status
-------------+---------+-------+----------+----------
local | unix | 34840 | 12990 | running
DC-01 | FSXN-01 | 34841 | 13001 | running
- Harvest Admin and Prometheus
Reviewing the dashboards
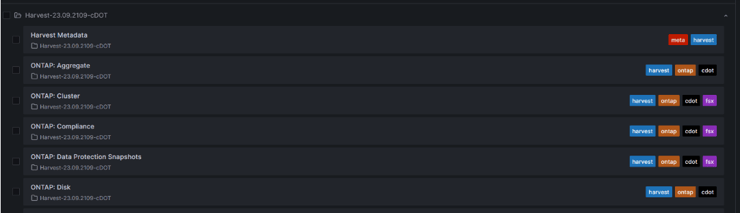
Finally, we can look at the performance data in the Grafana dashboards. With Amazon FSx for ONTAP there are only a few of these dashboards that can present the data.
To find them, look for the purple “fsx” tags to the right of each list item. Navigate to “Dashboards”. You should see something like this:
You can click on a dashboard, and it will open in the same tab. Once opened, you will see an empty star icon at the top. Click on that star icon to add that dashboard to the “starred” list so it will be easier to open later.
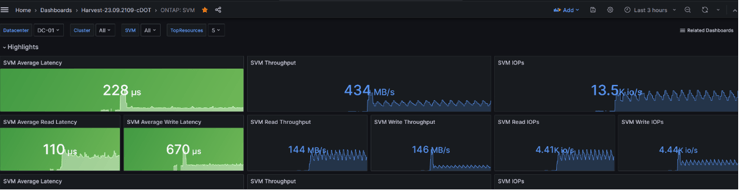
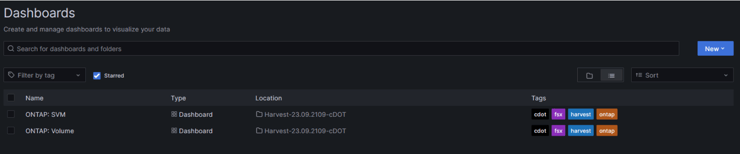
For instance, I starred the dashboards for “ONTAP:SVM” and “ONTAP:Volume”, which makes it easy for me to see these important dashboards all in one place.
And that’s it! You now have an easier way to monitor your FSx for ONTAP volumes through NetApp Harvest. Have fun!
Simplifying and Streamlining Operations with NetApp Cloud Insights
Complementing NetApp Harvest capabilities, NetApp offers a turnkey service, NetApp Cloud Insights, for gaining a comprehensive view of your Amazon FSx for NetApp ONTAP service. Cloud Insights centralizes performance monitoring and troubleshooting, reducing complexity and enhancing operational efficiency.
Cloud Insights automates routine tasks such as performance tracking using anomaly detection with its advanced analytics abilities, freeing teams to focus on strategic initiatives. Its out-of-the-box dashboards can be tailored to answer specific needs, such as troubleshooting FSx for ONTAP, migration and capacity planning, offering a clearer understanding of FSx for ONTAP operational status.
To learn more and start your FREE service, visit the Cloud Insight Activation page.
