Share
What Is Cloudwatch Monitoring?
Amazon Cloudwatch is an AWS monitoring service you can use to monitor your applications, services, and resources. It enables you to collect performance and operational data and compiles that data into interpretable metrics.
From the Cloudwatch homepage, you can visualize your metrics data in pre-built charts. You can also create custom dashboards to highlight the specific metrics or sets of metrics you need. These dashboards can provide system-wide visibility into your operations while alarms can alert you to resource or status changes.
In this article, you will learn:
- How Amazon Cloudwatch Works
- AWS Cloudwatch Concepts
- EC2 Metrics to Monitor in Cloudwatch
- EBS Metrics to Monitor in Cloudwatch
How Amazon Cloudwatch Works
Amazon Cloudwatch is made of three main components—storage, Cloudwatch Alarms, and an analytics and visualization engine. It serves as a metrics repository, holding metrics data delivered to it by your services and then exposes this data through analytics or alarms. You can also use Cloudwatch to ingest external data sources, keeping all of your metrics monitoring in one place.
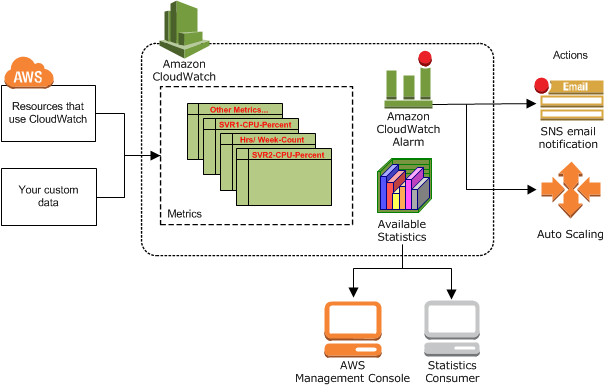
Image Source: AWS
Many AWS services, including EC2, Kinesis, and S3, automatically send metrics to Cloudwatch in one and five minute increments. For the first 12 months of your account, you can access a limited amount of these metrics for free. After that, there is a charge. To access your metrics data you can use the Management Console or ingest Cloudwatch data with third party tools.
Related content: read our guide to AWS monitoring tools (coming soon)
If you have resources in multiple regions, a Cloudwatch service operates in each. This means metrics from each region are stored separately. However, you can aggregate metrics using the Cloudwatch cross-region features as needed.
Related content: read our guide to Cloudwatch log insights which can help you run queries on log data collected by Cloudwatch
AWS Cloudwatch Concepts
When using Cloudwatch the following concepts are important to understand. These can help ensure you are interpreting metrics correctly and that you can apply insights effectively.
Namespaces
Namespaces are containers used to store metrics. These containers enable you to separate metrics from your various services and applications to ensure that you know which of your assets metrics are related to. When adding data sources to Cloudwatch, you need to define a namespace for each source and metric you collect.
Metrics
Metrics are time-series data sent to Cloudwatch. When accessing metrics, you can view data points individually or as an ordered set, depending on whether you want point in time information or trends.
Each metric you collect is defined by a namespace, zero or more dimensions, timestamps, and (if relevant) a unit of measure. Once metrics are collected, you cannot manually delete them. Instead, data is automatically purged after 15 months.
Timestamps
Timestamps are metadata used to determine when a metric was created or ingested. You can define timestamps from two hours in the future to two weeks in the past. Or, Cloudwatch can manually assign a stamp based on when the metric was received. Timestamps are used to order metrics data for analysis and to trigger alarms.
Dimensions
Dimensions are name/value pairs that categorize metric characteristics. Each metric you create can have up to 10 dimensions defined. You can use these dimensions to distinguish between multiple instances of the same service and to filter metrics by service use. For example, you can assign InstanceId dimensions to your EC2 instances to distinguish between them for monitoring.
Alarms
Alarms in Cloudwatch are thresholds defined by you for specific metrics. Alarms trigger according to state changes, not current values. You can use these alarms to start, stop, or terminate resources or to send a notification to your team that something has changed. To automate responses, you need to tie Cloudwatch Events to your service. Then you can use events to trigger actions.
EC2 Metrics to Monitor in Cloudwatch
When monitoring your EC2 instances, the following metrics can help you ensure that your instances are performing as expected.
NetworkIn, NetworkOut, NetworkPacketsIn, and NetworkPacketsOut
These metrics, in combination, can give you a solid understanding of how your network connections are performing. The network in/out metrics return your traffic volume in bytes while the packets in/out metrics return it in number of packets sent.
When watching these metrics, you should look for sharp increases, decreases, or long periods of time without traffic. When creating alarms for these values, consider using the Average statistic and alert when two points in a given period deviate.
CPUCreditBalance
Depending on the type of EC2 instances you are using, you may benefit from the CPUCreditBalance metric. This metric measures your current burst credit balance. Burst credits are used to enable your instances to process more operations temporarily. If you run out of burst credits, your performance will suddenly drop to baseline performance for that instance type.
When watching this metric, you need to catch changes before your credits run out. The best way to do this is to set an alarm for when your metric Average statistic drops below 25% of your maximum balance.
CPUUtilization
The CPUUtilization metric, measures the total percent of your instance CPU resources in use. This metric should fluctuate over time but should generally remain below 80% of your total available CPU. If it is consistently 50% or lower, this is an indication that you can downscale your instance.
When watching this metric, try to avoid looking at point in time values and focus on time periods. You should set alarms for consistent Average statistics over a certain percent, depending on your instance's priority.
EBS Metrics to Monitor in Cloudwatch
When monitoring your EBS volumes, the following metrics can help you ensure that you have the right amount of resources available.
VolumeTotalReadTime and VolumeTotalWriteTime
These metrics measure the amount of time your volume spends performing read/write operations. While these metrics are not very informative independently, together with read and write operations metrics they can help you monitor your volume latency.
To calculate this value, Cloudwatch uses the following formula:
(VolumeTotalReadTime + VolumeTotalWriteTime) / (VolumeReadOps + VolumeWriteOps)
You can set alarms based on this formula by using the Sum statistic for all metrics involved.
VolumeQueueLength
This metric measures how many volume operations you have queued. You should expect there to be a small queue at most or all times since a queue of zero means an idle volume. The goal is to alert before your queue gets too large.
When measuring this metric, you should set an alarm based on the Average statistic. If your average consistently increases over a given period with no decreases, this indicates an issue.
VolumeThroughputPercentage
This metric measures how much of your provisioned IOPS are available. This is different than what percentage is in active use. To fall within service level agreements, your volumes should remain within 10% of your provisioned amount 99.9% of the time. If you are seeing greater variation than this, it can indicate a problem with your application or the service itself.
When monitoring this metric, use the Average statistic and watch for values less than 90%. Because AWS generally handles issues with insufficient availability, this typically does not need to be a high priority alert.
Cloudwatch Monitoring with NetApp Cloud Insights
NetApp Cloud Insights is an infrastructure monitoring tool that gives you visibility into your complete infrastructure. With Cloud Insights, you can monitor, troubleshoot and optimize all your resources including your public clouds and your private data centers.
Unlike CloudWatch, NetApp Cloud Insights provides:
- Monitoring for all major cloud providers and on-prem infrastructure as well. Cloud Insights supports AWS, Azure, GCP and any legacy on-prem infrastructure, giving you a unified view of your multi-cloud environment that cannot be provided by a tool from a specific cloud provider.
- One pane of glass across the multi cloud environment, with one set of thresholds to set, one performance troubleshooting workflow, and one set of dashboards and visualizations. Even non-experts can perform triage and root-cause analysis regardless of where workloads are running.
- Wasted and over-provisioned resources easily identified and visualized across all cloud providers. Quickly see the busiest or worst performing resources per-application, even if that application bridges multiple clouds or on-prem resources.
- Metrics normalization, meaning that all dashboards and visualizations allow for straightforward apples-to-apples comparisons between platforms.
Start a 30-day free trial of NetApp Cloud Insights. No credit card required