Share
Whenever I discuss the topic of observability with an organization, which you may not be surprised to hear happens with some regularity, I ask different stakeholders just how many different tools they’re using. The answer is usually consistent across the individuals, typically in the range of three to five different tools. What’s not consistent is the tools they name – what eventually comes out by the end of the discussion is that there are many more tools in use than any one individual realized.
There’s generally consensus amongst analysts that 12-15 is the average number of tools in use, consistent with my experience. So, what’s the impact of this?
First, let’s consider a definition for observability. 451 Research defines it as:
“Making systems observable such that a site reliability engineer, DevOps or operations professional can obtain the visibility required to understand both a problem and its source, typically by flexibly analyzing a comprehensive set of data about application and infrastructure operations”
I can’t disagree with that, and if you think it sounds like a lot of time-consuming work, you’re right. It’s work that also needs experts on hand to carry out and needs them to be hopping between a dozen or more different tools to get the full picture.
With triage and troubleshooting, there’s often a known window where issues were experienced of perhaps an hour. The SREs, DevOps and operations professionals that 451 refers to have potentially millions of metrics from thousands of different sources to trawl through, in what’s usually a high-pressure situation, to try to figure out what has happened, and how it can be fixed.
Cloud Insights mitigates some of these challenges with full-stack coverage of your environment, with consistent troubleshooting workflows across all resources, minimizing the number of tools that need to be called on for triage and diagnostics. To this we add an intuitive UI, simple-to-use filters and finders, metadata and tagging and automatically identified relationships and topologies to limit the enormity of the scope of metrics under inspection and save time, but there was still more we could do.
To that end we’ve brought an AI/ML backed engine to Cloud Insights that automatically identifies problematic, and potentially problematic scenarios and highlights them to the team. No rules to define, no thresholds to set and no special monitors to create.
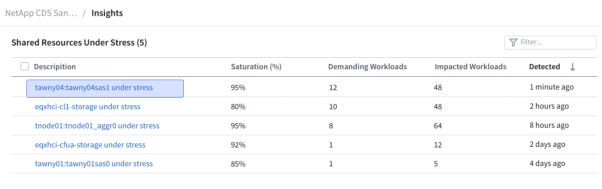
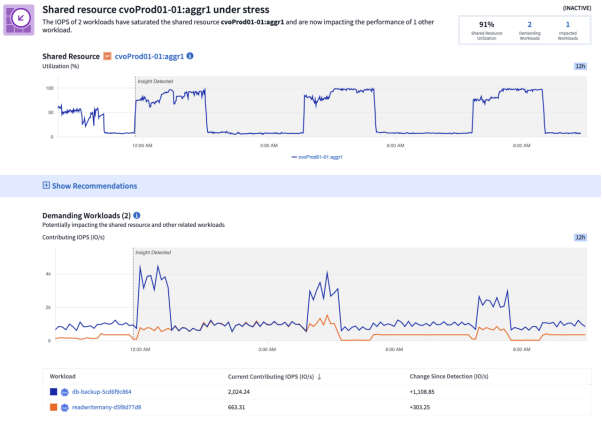
The first of these AI insights available today is that of identifying shared resources under stress along with the workloads most likely to be contributing to and affected by it.
This can be a particularly tricky situation to get to the bottom of, because nothing is actually broken. Let’s take storage for instance – shared storage exists to provide capacity and a certain level of performance to the multitude of workloads using it, but of course there’s a finite amount of performance on tap. When one workload starts demanding more on the storage than it’s designed to deliver, this usually presents itself as a storage issue to all the other workloads. There’s an expectation of a certain level of latency and a certain amount of I/O throughput and it’s not delivering. As a former storage architect myself, I can’t count the number of times I’ve been at the wrong end of a sharp stick because “the storage wasn’t performing”, but on every occasion I care to recall the storage was performing as designed, and was simply over-stressed. It’s usually a batch job, a periodic data load, some QA or testing workloads, a database initialization – a workload taking up more than its fair share of resources to the detriment of the other related workloads. Figuring this out without the benefit of a tool that understands the topology and relationships at play is easier said than done.
Since Cloud Insights not only collects metrics for the full stack, but also automatically builds an understanding of the topology, we can now figure it out for you, proactively.
But as the saying goes, prevention is the best cure. So, for example, if we can predict when shared resources are going to run out capacity before it happens and causes outages, even better.
Containerized applications and Kubernetes specifically have become the backbone of many organizations’ IT strategy as it removes a great deal of inertia from application development and allows dev teams to do more, more quickly, without worrying about dependencies on infrastructure resources. When a production cluster runs out of capacity you can bet that will be an all-hands-on-deck incident, and since the infrastructure is abstracted from the applications using it, this can happen all too easily.
Today in preview*, we’re predicting time to full for your shared storage, and with automatic K8s persistent volume to storage mapping, your Kubernetes Clusters themselves.
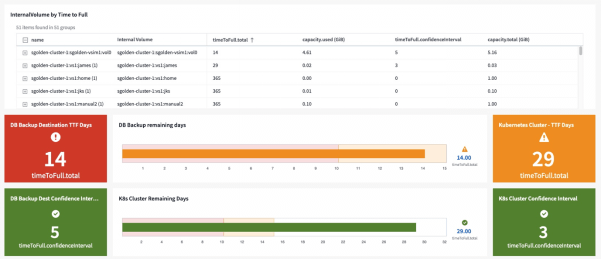
We take all the indicators and history into account to make a prediction of when you will run out of capacity headroom. Or hopefully not! This lets you either scale out or re-allocate workloads before it comes to that, thus preventing outages entirely, and saving you time and headaches, and preventing you from being at the end of the aforementioned sharp stick.
Of course, we’re not stopping there, with dozens more insights planned. Stay tuned for more exciting news and updates as we take Cloud Insights to the next level.
If you want to experience Cloud Insights’ full-stack troubleshooting and resource management, waste optimization and ransomware detection yourself in your own environment, check out our free 30-day trial, no credit card required. Then you can see all that Cloud Insights has to offer for yourself.
*Contact your NetApp sales team to request access to preview functionality.