Share
Azure monitoring dashboards enable you to visualize cloud and on-prem data. To do this natively, you can use Azure Monitor, which provides capabilities for single pane visualizations as dashboards, and interactive documents called workbooks. You can also integrate third-party tools, such as Power BI and Grafan, which extend your visualization capabilities further.
In this post, we’ll examine the pros and cons of three Azure monitoring dashboards by Azure Monitor, Power BI, and Grafana. We will also explain how to create and share dashboards in Azure Monitor, and show how NetApp Cloud Insights can help you identify insights to improve cloud performance and billing.
In this article, you will learn:
● Monitoring in Azure Monitor
● Azure monitoring dashboard with Power BI
● Azure dashboard with Grafana
● Create and share dashboards in Azure Monitor
● Customized Azure Monitoring Dashboard with NetApp Cloud Insights
Option 1: Monitoring in Azure Monitor
Azure Monitor is a service that you can use to monitor your applications and services via dashboards or workbooks. It is designed to help you collect, analyze, and apply log and metrics data from on-premises and cloud resources. By helping you understand your assets' telemetry, you can better identify issues and optimize availability and performance.
Azure Monitor is a centralized hub of monitoring information that leverages multiple Azure utilities, including Log Analytics and Application Insights. It can deliver telemetry data to both third-party and Azure analysis tools. These integrations grant flexibility in your monitoring and ensure effective analysis of data.
Learn how to properly use Azure log data using best practices and industry standards in our guide: Azure logging (coming soon)
Dashboards
Azure dashboards are a single pane from which you can oversee your Azure services and infrastructure. With Azure Monitor, these dashboards are broken down into views. Views are tiles that display specific summaries of information. You can display this information in multiple forms, including lists, line charts, and bar graphs.
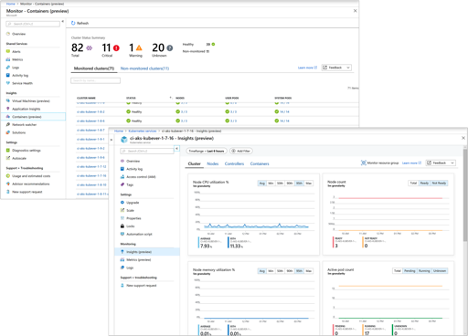
Source: Azure
Azure Monitor includes many built-in views that you can add to your dashboards. You can also create custom views through log queries.
Pros of dashboards include:
● You can pin views to your dashboard from throughout Azure, including Application Insights, Log Analytics, and Metrics Explorer.
● You can combine data from across your environment, including from external services.
● You can create both shared and personal dashboards with access determined through role based authentication.
● Dashboards automatically refresh with metrics data every five minutes and log data every hour. You can also manually refresh data.
● Dashboards are customizable with options for custom parameters and flexible layouts.
Cons of dashboards include:
● Log views do not support data tables and only support up to 10 data series.
● You cannot add custom parameters to log charts.
● You can only pin log charts to shared dashboards and only display 30 days off information.
● Dashboard data is not interactive and you are limited in your ability to drill-down for context.
Workbooks
Workbooks in Monitor are interactive documents that you can use to gain deeper insight into your monitoring data. With workbooks, you can collaborate with your team and investigate incidents. For example, you can use workbooks for incident postmortems or to create troubleshooting guides that teams can follow.
Pros of workbooks include:
● Workbooks support logs and metrics.
● You can use parameters selection to update views dynamically.
● You can create personal or shared workbooks from scratch or through public templates on GitHub.
● Workbook authoring is intuitive and based on a document-like flow.
Cons of workbooks include:
● Workbooks do not automatically refresh like dashboards.
● Workbooks are designed for targeted analyses and do not offer dense layouts like dashboards.
Learn about the difference between first-party and third-party Azure monitoring services in our guide: Azure monitoring tools (coming soon)
Option 2: Azure Monitoring Dashboard with Power BI
Power BI is a business intelligence analytics service that you can use to create and share interactive reports and dashboards. Power BI is particularly focused on business-centric data, such as key performance indicator (KPI) trends, compliance, and streaming analytics. You can use it to ingest data from Azure Monitor or directly from a data lake and can create AI models for custom analytics.
Pros of Power BI include:
● Customizable visualizations with the ability to cross-filter and zoom in.
● Insights are easy to share through a desktop interface or printed reports.
● You can integrate a variety of data sources, including Excel.
● Results are cached for better performance.
Cons of Power BI include:
● Power BI does not include support for metrics.
● You cannot manage BI models or dashboards through Azure Resource Manager.
● You must import query results into Power BI models for configuration.
● Results refresh is limited to eight times each day.
Option 3: Azure Dashboard with Grafana
Grafana is an open source visualization platform that you can use to query, visualize, and alert on metrics data. With Grafana, you can ingest data from almost any source and create custom operational dashboards for monitoring or triaging incidents. To use Grafana with Azure Monitor, you can add the Grafana plugin to your Azure subscription.
Pros Grafana include:
● You can use a wide variety of visualizations, including histograms, geo maps, heatmaps, and graphs.
● Grafana supports over 30 data sources, including open source and commercial sources.
● Dashboards are interactive with the ability to zoom-in, dynamically drill down, and perform ad-hoc queries.
● You can mix data sources in a single graph for more comprehensive insights.
Cons of Grafana include:
● Grafana is integrated through a plugin, meaning you can’t manage dashboards through Azure Resource Manager.
● Grafana uses a separate infrastructure, meaning you need additional resources to host it or use it through Grafana Cloud.
Learn how Azure metric alerts and Azure log alerts work in our guide: Azure monitoring alerts (coming soon)
Quick Tutorial: Create and Share Dashboards in Azure Monitor
In your Azure Portal, a default dashboard is available that you can edit and customize. You can also create additional dashboards for personal use or to share with others through role-based access controls (RBAC).
Using RBAC, you can provide permissions at the subscription, resource group, or resource level. This enables you to specify that users have access to a single dashboard (a resource), a cluster of dashboards, or any dashboard created in your account. Within those levels, you can also assign roles such as reader, contributor, or owner. These roles determine whether users can view, modify, create, or delete dashboards.
Creating a New Dashboard
After you have evaluated the default dashboard options, you should begin making custom dashboards for greater productivity.
1. From the Azure Portal, choose Dashboard.
2. Click New dashboard to open the Tile Gallery.
3. In the workspace, add any tiles you want to include in your dashboard and name your dashboard.
4. Once you're done, click Done customizing. Once you're done, click Done customizing. You can now view your custom dashboard.
Publishing a Dashboard
After your custom dashboard is created, you need to share it with your users. This requires publishing the dashboard.
1. From the dashboard you want to publish, click Share in the toolbar.
2. From the Sharing + access control screen, confirm your subscription name and which group you want to publish to. Dashboards are published by default to the ‘dashboards’ resource group but you can define another group by unchecking the default box. When finished, click Publish.
3. Assuming that your inherited subscription permissions are correct, your dashboard is shared. If you need to customize permissions, you can do so through the Sharing + access control screen by selecting Manage users.
Customized Azure Monitoring Dashboard with NetApp Cloud Insights
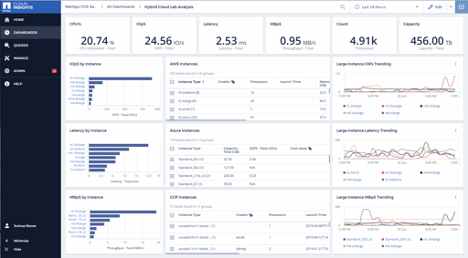
NetApp Cloud Insights is an infrastructure monitoring tool that gives you visibility into your complete infrastructure. With Cloud Insights, you can monitor, troubleshoot and optimize all your resources including your public clouds and your private data centers.
Cloud Insights helps organizations reduce mean time to resolution by 90%, prevent 80% of cloud issues from impacting end users, and reduce cloud infrastructure costs by an average of 33%. It can even reduce your exposure to insider threats by identifying risks to sensitive data.
In particular, NetApp Cloud Insights provides a Dashboard Gallery that helps you create relevant dashboards instantly, or customize dashboards quickly to suit your needs. With NetApp Cloud Insights, you can leverage Azure monitoring dashboard insights for costs optimization, by identifying unused resources and right-sizing opportunities.